Low imported prices cause deflation to continue
- Details
- Category: Economic Releases
- Created: 16 July 2015
| Inflation May 2015 |
Release date: 16 July 2015 |
|||
| May 15 | Apr 15 | Mar 15 | Feb 15 | |
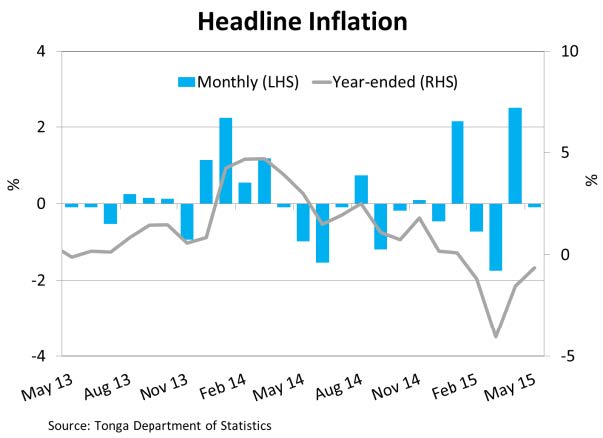
| Headline * | -0.6 | -1.5 | -4.0 | -1.1 |
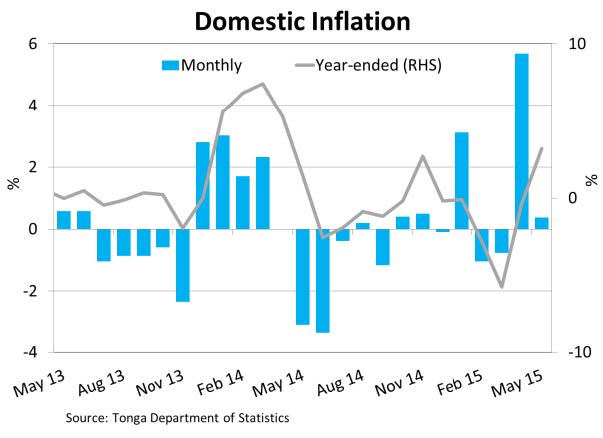
| Domestic ^ | 1.3 | -0.2 | -2.4 | -1.2 |
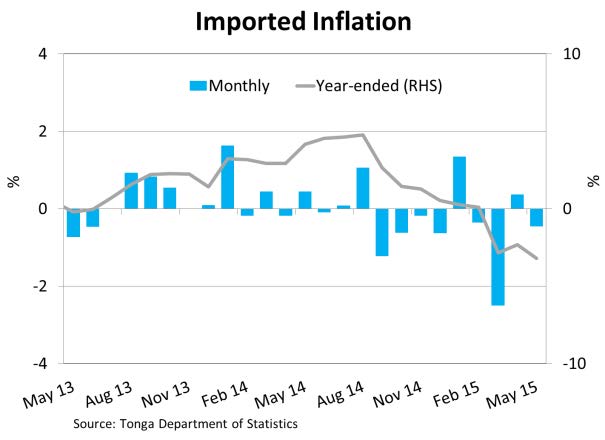
| Imported ^ | -1.9 | -1.3 | -1.7 | 0.0 |
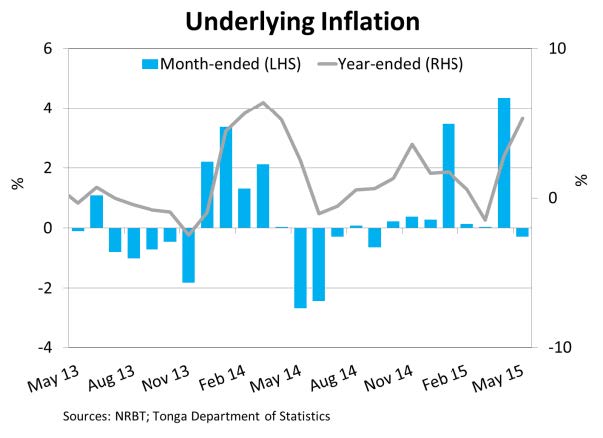
| Underlying * | 5.3 | 2.8 | -1.5 | 0.6 |
| * Year-ended growth | ||||
| ^ Percentage point contribution to year-ended growth | ||||
Low imported prices cause deflation to continue
CPI dropped by 0.1% over May as a result of a 0.5% fall in Imported prices. In particular, prices declined for Food items such as Fruit & Vegetables, and Meats, Fish & Poultry. The Tongan Pa’anga appreciated against the New Zealand Dollar which could have contributed to the low imported food prices. Contrastingly, prices for Domestic fuel and power, and Transportation increased over the month due to recovering global oil prices. The overall level of Domestic prices rose by 0.4% slightly offsetting the monthly inflation decline.
In annual terms, the headline inflation rate fell by 0.6% as a result of global energy prices being 29% lower than the previous year. Consequently, this caused Imported prices to decrease by 3.2%, particularly for the Household Operation and Transportation components. Additionally, Imported Food prices decreased by 2.1% due to a decline in prices for Meats, Fish & poultry, and Cereals & cereal products. This had offset the rises for Imported Clothing & Footwear, and Tobacco & Alcohol prices. On the contrary, Domestic prices rose by 3.2% as a result of higher Food prices, specifically local Fruit & vegetables. Furthermore, the annual core inflation rate (excluding energy and imported food) increased by 5.3% indicating the significant influence global prices has on inflation.
On the outlook, the NRBT continues to expect that headline inflation will remain negative until the end of this calendar year. However, recent developments in world oil prices could alter the current forecast. In spite of these changes, deflation is still expected to affect consumers by raising their purchasing power and businesses by discouraging investments. The NRBT will continue to closely monitor the country’s economic and financial conditions in order to maintain and promote economic prosperity.
 |
 |
 |
 |
Inflation Breakdown *
| Weight |
Month-ended | Year-ended | |||
| Change | Contribution to total ppt |
Change | Contribution to total ppt |
||
| % | % | ||||
| CPI | 100 | -0.1 | -0.1 | -0.6 | -0.6 |
| Domestic | 42.2 | 0.4 | 0.1 | 3.2 | 1.3 |
| Food | 17.8 | -1.0 | -0.2 | 11.2 | 2.0 |
| Fruit & vegetables | 6.5 | -3.2 | -0.3 | 31.7 | 2.2 |
| Meats, fish & poultry | 3.7 | 3.1 | 0.1 | -2.2 | -0.1 |
| Dairy farm, vegetable products | 0.5 | 0.7 | 0.0 | -0.8 | 0.0 |
| Cereals & cereal products | 3.4 | 0.0 | 0.0 | -4.1 | -0.1 |
| Other food | 0.0 | 0.0 | 0.0 | 0.0 | 0.0 |
| Drinks, sweets and meal away from home | 3.7 | 0.0 | 0.0 | 0.6 | 0.0 |
| Transportation | 0.5 | 0.2 | 0.0 | -0.1 | 0.0 |
| Tobacco & Alcohol | 1.5 | 0.0 | 0.0 | 0.0 | 0.0 |
| Household Operation | 17.3 | 2.2 | 0.3 | -4.4 | -0.7 |
| Domestis Power & Fuel | 6.0 | 6.7 | 0.3 | -12.5 | -0.7 |
| Household Appliances | 0.0 | 0.0 | 0.0 | 0.0 | 0.0 |
| Household furniture & furnishing & textiles | 1.4 | 0.0 | 0.0 | 2.0 | 0.0 |
| Household supplies & services | 4.7 | 0.0 | 0.0 | 0.0 | 0.0 |
| Communication services | 5.2 | 0.0 | 0.0 | 0.0 | 0.0 |
| Clothing & Footwear | 0.0 | 0.0 | 0.0 | 0.0 | 0.0 |
| Housing | 1.7 | 0.0 | 0.0 | 0.0 | 0.0 |
| Miscellaneous goods & services | 3.5 | 0.0 | 0.0 | 0.0 | 0.0 |
| Imported | 57.8 | -0.5 | -0.2 | -3.2 | -1.9 |
| Food | 27.9 | -1.5 | -0.4 | -2.1 | -0.6 |
| Fruit & vegetables | 0.9 | -0.7 | 0.0 | 1.4 | 0.0 |
| Meats, fish & poultry | 14.6 | -2.8 | -0.5 | -4.4 | -0.7 |
| Dairy farm, vegetable products | 3.2 | 0.1 | 0.0 | 1.4 | 0.0 |
| Cereal & cereal products | 3.5 | -0.1 | 0.0 | -2.4 | -0.1 |
| Other food | 5.7 | 0.6 | 0.0 | 3.2 | 0.2 |
| Drink, sweets and meal away from home | 0.0 | 0.0 | 0.0 | 0.0 | 0.0 |
| Transportation | 11.5 | 1.6 | 0.2 | -14.5 | -1.7 |
| Private | 8.6 | 2.1 | 0.2 | -18.6 | -1.7 |
| Public | 2.9 | 0.0 | 0.0 | -0.5 | 0.0 |
| Tobacco & Alcohol | 4.5 | 0.6 | 0.0 | 6.7 | 0.3 |
| Tobacco | 2.9 | 0.9 | 0.0 | 11.4 | 0.3 |
| Alcohol | 1.6 | 0.0 | 0.0 | -2.3 | 0.0 |
| Kava | 0.0 | 0.0 | 0.0 | 0.0 | 0.0 |
| Household Operation | 3.5 | 0.1 | 0.0 | -7.2 | -0.2 |
| Domestic Power & Fuel | 1.1 | 0.0 | 0.0 | -20.7 | -0.3 |
| Household Applicances | 1.2 | 0.0 | 0.0 | 1.6 | 0.0 |
| Household furniture, furnishing & textiles | 0.0 | 0.0 | 0.0 | 0.0 | 0.0 |
| Household supplies & services | 1.2 | 0.0 | 0.0 | -0.9 | 0.0 |
| Communication services | 0.0 | 0.0 | 0.0 | 0.0 | 0.0 |
| Clothing & Footwear | 3.2 | 0.0 | 0.0 | 8.4 | 0.3 |
| Housing | 0.8 | 1.9 | 0.0 | -0.2 | 0.0 |
| Miscellaneous goods & services | 6.4 | 0.0 | 0.0 | 1.8 | 0.1 |
| Underlying CPI measures | |||||
| Ex. Energy ** | 81.4 | -0.7 | -0.6 | 2.6 | 2.1 |
| Ex. imported food | 72.1 | 0.5 | 0.3 | 0.0 | 0.0 |
| Ex. energy and imported food | 53.5 | -0.3 | -0.2 | 5.3 | 2.7 |
* Due to rounding and Tonga Department of Statistics errors some data may not aggregate precisely
** Excluded from the 'Ex energy' index is imported transportation and 'domestic fuel and power' component of 'Household operation'.
Source: Tonga Department of Statistics
Download a copy of the Inflation Rate Report for May.