Domestic prices continue to drive a rise in inflation
- Details
- Category: Economic Releases
- Created: 21 September 2015
| Inflation July 2015 |
||||
| Jul 15 | Jun 15 | May 15 | Apr 15 | |
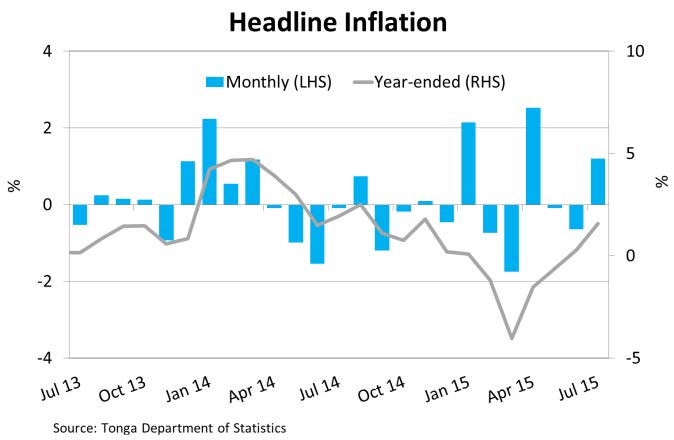
| Headline * | 1.6 | 0.2 | -0.6 | -1.5 |
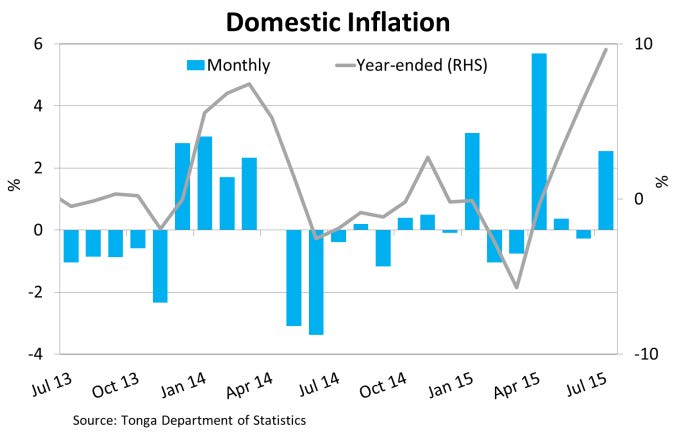
| Domestic ^ | 3.9 | 2.6 | 1.3 | -0.2 |
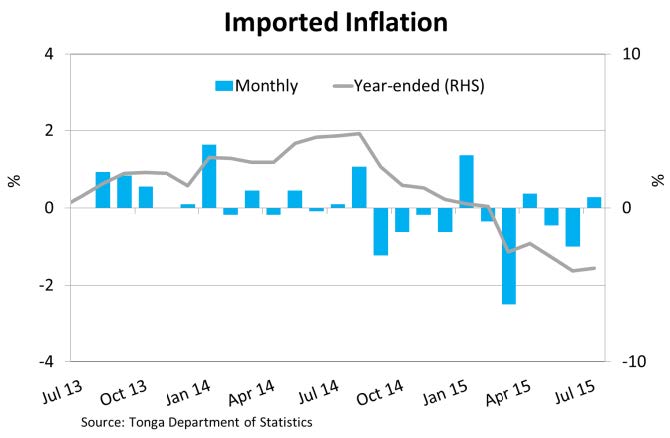
| Imported ^ | -2.3 | -2.4 | -1.9 | -1.3 |
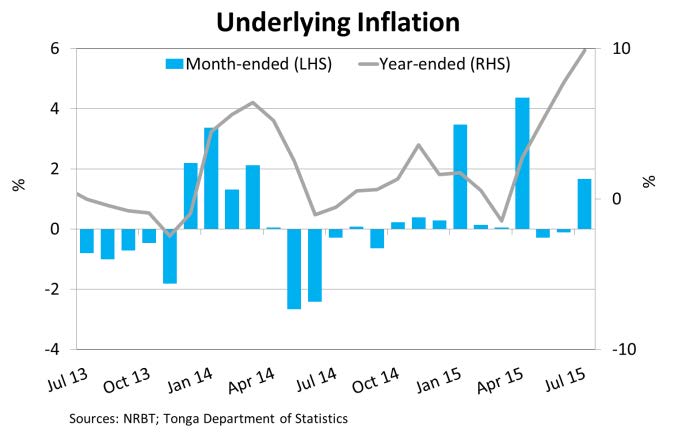
| Underlying * | 9.9 | 7.8 | 5.3 | 2.8 |
| * Year-ended growth | ||||
| ^ Percentage point contribution to year-ended growth | ||||
Domestic prices continue to drive a rise in inflation
The CPI increased by 1.3% over the month. This was driven mainly by a 2.6% rise in Domestic prices. Specifically, Domestic Food prices rose such as Fruit & Vegetables, and Meats, Fish & Poultry. This coincides with Quarantine and Rainfall data suggesting low agricultural yields which could explain the higher prices for Domestic Food items. Additionally, high demand for domestic foods for the FWC Conference, school anniversaries, and family reunions could have contributed to the increase in prices. Moreover, Imported prices rose by 0.3% as a result of recovering global oil prices coupled with the Tongan pa’anga depreciating against the U.S. Dollar, which affected the Transportations component. This rise had offset the fall in Imported Food prices, which was supported by the Tongan Pa’anga appreciating against the New Zealand Dollar.
In annual terms, the headline inflation rate increased by 1.6% due to Domestic prices, rising by 9.7%. This was caused largely by higher prices for local food items such as Fruit & Vegetables, and Meats, Fish & Poultry which had also offset declines in prices of other Domestic items. The rise in Domestic Food prices over the year to June could be driven by unfavourable weather conditions resulting in lower supply. In contrast, Imported prices dropped by 3.9% over the year as a result of lower Food prices for most food items. Additionally, the decline in global oil prices greatly lowered the Transportation costs and the Household Operations component, specifically electricity prices. Furthermore, the annual core inflation rate (excluding energy and imported food) increased by 9.9% indicating the significant influence global prices has on inflation.
On the outlook, the NRBT continues to expect that headline inflation will remain low until the end of this calendar year. However, recent developments in world oil prices and food prices could alter the current forecast. The NRBT will continue to closely monitor the country’s economic conditions in order to maintain price stability and promote economic prosperity.
 |
 |
 |
 |
Inflation Breakdown *
| Weight |
Month-ended | Year-ended | |||
| Change | Contribution to total ppt |
Change | Contribution to total ppt |
||
| % | % | ||||
| CPI | 100 | 1.3 | 1.3 | 1.6 | 3.9 |
| Domestic | 42.2 | 2.6 | 1.1 | 9.7 | 3.9 |
| Food | 17.8 | 5.1 | 1.0 | 28.8 | 4.8 |
| Fruit & vegetables | 6.5 | 8.7 | 0.8 | 79.3 | 4.6 |
| Meats, fish & poultry | 3.7 | 5.7 | 0.2 | 11.8 | 0.4 |
| Dairy farm, vegetable products | 0.5 | 0.0 | 0.0 | -3.7 | 0.0 |
| Cereals & cereal products | 3.4 | 0.0 | 0.0 | -4.1 | -0.1 |
| Other food | 0.0 | 0.0 | 0.0 | 0.0 | 0.0 |
| Drinks, sweets and meal away from home | 3.7 | 0.0 | 0.0 | 0.0 | 0.0 |
| Transportation | 0.5 | 0.0 | 0.0 | 0.0 | 0.0 |
| Tobacco & Alcohol | 1.5 | 0.0 | 0.0 | 0.0 | 0.0 |
| Household Operation | 17.3 | 0.5 | 0.1 | -5.6 | -0.9 |
| Domestis Power & Fuel | 6.0 | 3.6 | 0.2 | -9.3 | -0.6 |
| Household Appliances | 0.0 | 0.0 | 0.0 | 0.0 | 0.0 |
| Household furniture & furnishing & textiles | 1.4 | 0.0 | 0.0 | 2.0 | 0.0 |
| Household supplies & services | 4.7 | -3.0 | -0.1 | -9.0 | -0.4 |
| Communication services | 5.2 | 0.0 | 0.0 | 0.0 | 0.0 |
| Clothing & Footwear | 0.0 | 0.0 | 0.0 | 0.0 | 0.0 |
| Housing | 1.7 | 0.0 | 0.0 | 0.0 | 0.0 |
| Miscellaneous goods & services | 3.5 | 0.0 | 0.0 | 0.0 | 0.0 |
| Imported | 57.8 | 0.3 | 0.2 | -3.9 | -2.3 |
| Food | 27.9 | -0.6 | -0.2 | -5.2 | -1.5 |
| Fruit & vegetables | 0.9 | -2.4 | 0.0 | -3.5 | 0.0 |
| Meats, fish & poultry | 14.6 | -0.7 | -0.1 | -9.9 | -1.7 |
| Dairy farm, vegetable products | 3.2 | -0.3 | 0.0 | 1.4 | 0.0 |
| Cereal & cereal products | 3.5 | -0.9 | 0.0 | -1.5 | -0.1 |
| Other food | 5.7 | -0.1 | 0.0 | 2.8 | 0.2 |
| Drink, sweets and meal away from home | 0.0 | 0.0 | 0.0 | 0.0 | 0.0 |
| Transportation | 11.5 | 3.5 | 0.4 | -9.6 | -1.2 |
| Private | 8.6 | 4.8 | 0.4 | -12.2 | -1.1 |
| Public | 2.9 | 0.0 | 0.0 | -0.5 | 0.0 |
| Tobacco & Alcohol | 4.5 | 0.6 | 0.0 | 7.9 | 0.3 |
| Tobacco | 2.9 | 1.1 | 0.0 | 11.6 | 0.3 |
| Alcohol | 1.6 | 0.0 | 0.0 | 0.7 | 0.0 |
| Kava | 0.0 | 0.0 | 0.0 | 0.0 | 0.0 |
| Household Operation | 3.5 | -1.4 | 0.0 | -6.0 | -0.2 |
| Domestic Power & Fuel | 1.1 | -1.9 | 0.0 | -15.9 | -0.2 |
| Household Applicances | 1.2 | 0.0 | 0.0 | 1.6 | 0.0 |
| Household furniture, furnishing & textiles | 0.0 | 0.0 | 0.0 | 0.0 | 0.0 |
| Household supplies & services | 1.2 | -2.4 | 0.0 | -3.4 | 0.0 |
| Communication services | 0.0 | 0.0 | 0.0 | 0.0 | 0.0 |
| Clothing & Footwear | 3.2 | 0.0 | 0.0 | 8.2 | 0.3 |
| Housing | 0.8 | -1.2 | 0.0 | -2.1 | 0.0 |
| Miscellaneous goods & services | 6.4 | 0.0 | 0.0 | -0.2 | 0.0 |
| Underlying CPI measures | |||||
| Ex. Energy ** | 81.4 | 0.9 | 0.7 | 4.3 | 3.5 |
| Ex. imported food | 72.1 | 2.0 | 1.5 | 4.5 | 3.1 |
| Ex. energy and imported food | 53.5 | -1.7 | 0.9 | 9.9 | 5.0 |
* Due to rounding and Tonga Department of Statistics errors some data may not aggregate precisely
** Excluded from the 'Ex energy' index is imported transportation and 'domestic fuel and power' component of 'Household operation'.
Source: Tonga Department of Statistics